Why? (as in, why did you bother?)
A little backstory...
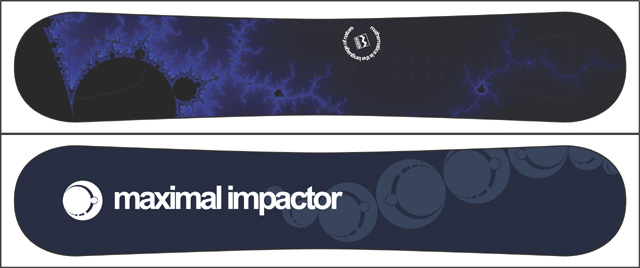
A while back, my best friend defended his thesis and walked away with his Ph.D. in Physics. This event marked the end of no fewer than 11 years of higher education for the lad. If ever I was going to get him something nice, then this was the time. But what? I settled on a snowboard.
After shopping around for about a week, I couldn't find any that I liked. Shopping online revealed that it wouldn't be that much of a price difference to have a custom board made. So now I needed to work up a graphic that suited the rider.
Snowboard graphics are big. Really big. Big like in the neighborhood of 12" wide by 72" tall at 300dpi. This meant that I couldn't easily make a composite image that would be big enough. All the images you find on the internet would be miniscule. To make matters worse, I'm not exactly an artist. If these pages say anything about me...that's it. No, I'd have to generate something.
I seemed to recall Jonathan liked fractals ever since we were kids, and his thesis involved some aspect of chaos theory. The obvious answer was to render an enormous fractal image. So I went around looking for Mandelbrot Set generators that would do what I needed. That is, render in a user-defined color scheme, be easy to use, and save to a common graphical format at more than 20,000 by 4,000 pixels.
I didn't find it, so I went about making my own.
The Mandelbrot Set
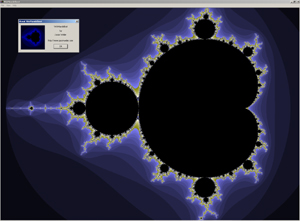
I'm not going to go into too much detail here, but this is just a quicky explanation of the Mandelbrot set. It involves graphing complex numbers of the form (x+yi) where i is the sqrt(-1). The Mandelbrot equation is an iterative one of the form:
Zn=Zn-12 + C
where C is our complex number. If after many iterations, the absolute value of Zn is less than 2, then the complex value C is said to be in the set. If the value is divergent (ie. greater than 2), then the value is not in the set. The value of Z0 is C.
I'm really just a fractal tourist, and I can't possibly do this subject justice. For more information on this topic, look here and here.
Rendering
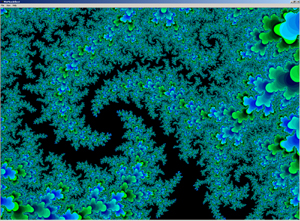
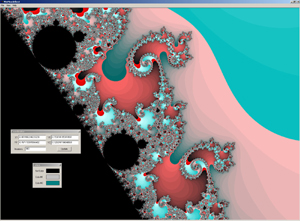
Like many other Mandelbrot generators, the graphically interesting parts are at the edges between the values that are in the set and those that are just outside of the set. We can derive color from the number of iterations of the equation it took before the number was greater than two. Of course, values in the set have all used the maximum number of iterations and so are all the same color.
The program will let you choose three different colors. One for the value inside the set, and two for the range of colors outside of the set.
Download
If you wanted to play around with this, the latest version can be downloaded from this site. The source isn't available just yet, but it will be once I clean it up a little more and put in a few more tweaks.
Usage
There's really nothing to it.
- Clicking on the image will zoom in on that area.
- Click-dragging will zoom on on a user-defined box.
- Alt-clicking will zoom out.
- The view menu will let you bring up the coordinates and colors dialog boxes (modeless).
- You can use these to fine tune your image. Increasing the number of iterations will generally reduce the color-banding, but it'll increase the rendering time.
- Rendering to a file isn't available in this release, but save-to-file is. So what's the difference? Save-to-file will save the current screen image pixel-for-pixel to a file. Render-to-file will allow you to render the current image to a file in an arbitrary resolution.
Coulda Woulda Shoulda
When I first sat down to write this program, I just mocked it up as a simple windows dialog. It wasn't resizeable or the least bit friendly. Remember, this was supposed to be a simple one-off project in the beginning. Once I had the snowboard done, I expected to let this thing collect dust until a harddrive failure ultimately made it go away.
Well that wasn't to be, and I kept working on this project in spite of having better things to do with my time. I cleaned up the interface, made the zooming a little more intuitive. Added some features, etc, etc. As I did these things, the program's structure shifted dramatically towards the Doc/View architecture commonly seen in MFC applications. If I had to write this all over again, I'd probably just write it within the MFC framework in the first place. Coulda Woulda Shoulda...
Version History
1.1.1.4:
Improved:
Added a job queue and support for multi-core calculations
1.1.0.3:
Fixed:
Save-to-file function. Output is always a 24-bit windows bitmapImproved:
Sped up color re-rendering by orders of magnitude. There is no longer a noticable lag.
1.1.0.2:
- Initial binary release with known save-to-file/render-to-file issues
Epilogue
In the end, I did enlist some artistic help with the snowboard project. Frank Germano at Frame8 cleaned up my initial layout of the top sheet and he did a pretty cool mandelbrot-inspired base sheet.


